Has Ozempic led to a fall in obesity in the USA?

The Financial Times has released a new report that uses data from the USA to claim that the USA's historically high obesity rates have begun to fall, and suggesting that this fall in rates is due to the weight-loss drug Ozempic. The key information in the report is shown in a graph of age-adjusted obesity prevalence from the National Health and Nutrition Survey, shown in Figure 1 here.
Figure 1: FT reported trend for obesity in US adults, 1990 - 2022
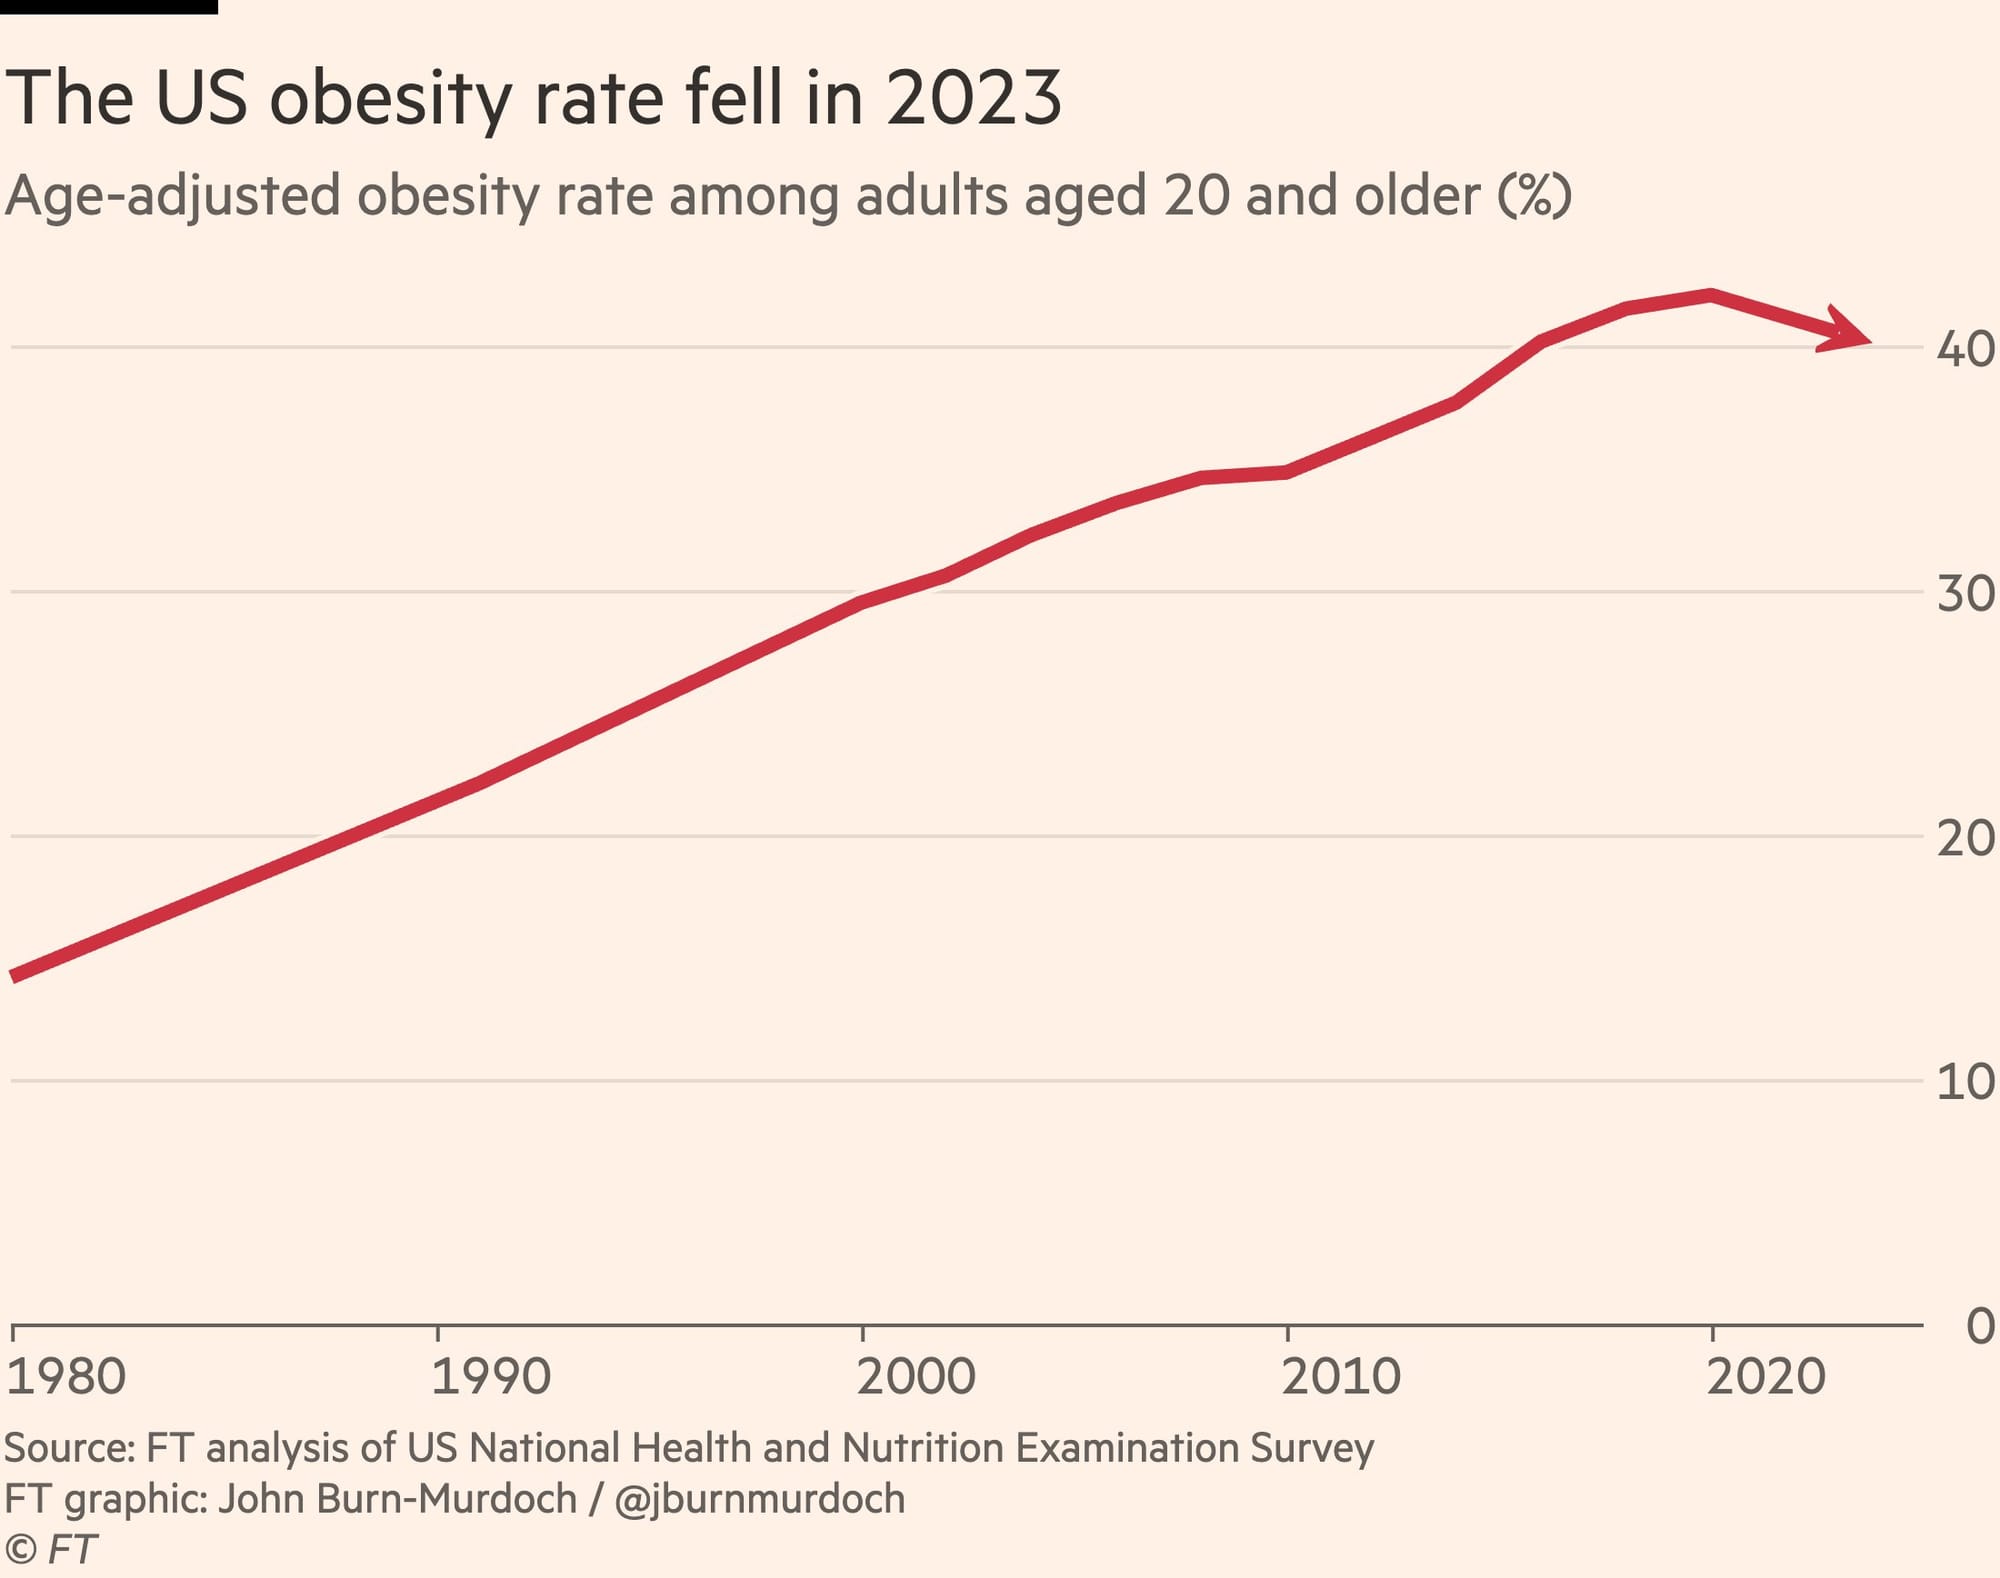
This figure certainly presents a compelling story that US obesity has turned around. The author, John Burn-Murdoch, then argues that this is because of Ozempic, which has become hugely popular in the USA and which he claims 1 in 8 American adults have used, with 6% of adults currently using it. These statistics combined are used to weave a tale of the end of obesity.
Unfortunately, the statistics this report relies on are not reliable, and we need to be cautious about drawing conclusions from the data the FT presents. Here I will explain why the statistics in that report are wrong, and sound a cautionary note about the influence of Ozempic on obesity rates.
The collapse of the NHANES Survey
The key figure from the FT report is the decline in obesity rates in the USA. The FT report suggests that the age-adjusted obesity rate in the USA peaked in 2018 and has now dropped significantly. While numerically this is true, the report fails to mention an important caveat on the NHANES data: the response rate of the NHANES survey crashed after the COVID-19 pandemic. Figure 2 shows the response rate in the three most recent surveys, by sex. In this figure the year of the survey is simplified for presentation purposes - the survey is typically collected over a 1-2 year period. The most recent survey was conducted from 2021 - 2023, and was the first post-pandemic survey. The previous two surveys folded into each other, with the one labeled 2018 in Figure 2 conducted in 2017-2018, and the one labeled 2020 conducted in 2017 - 2020 (so an extension of the previous one).
Figure 2: NHANES response rate in the most recent three surveys
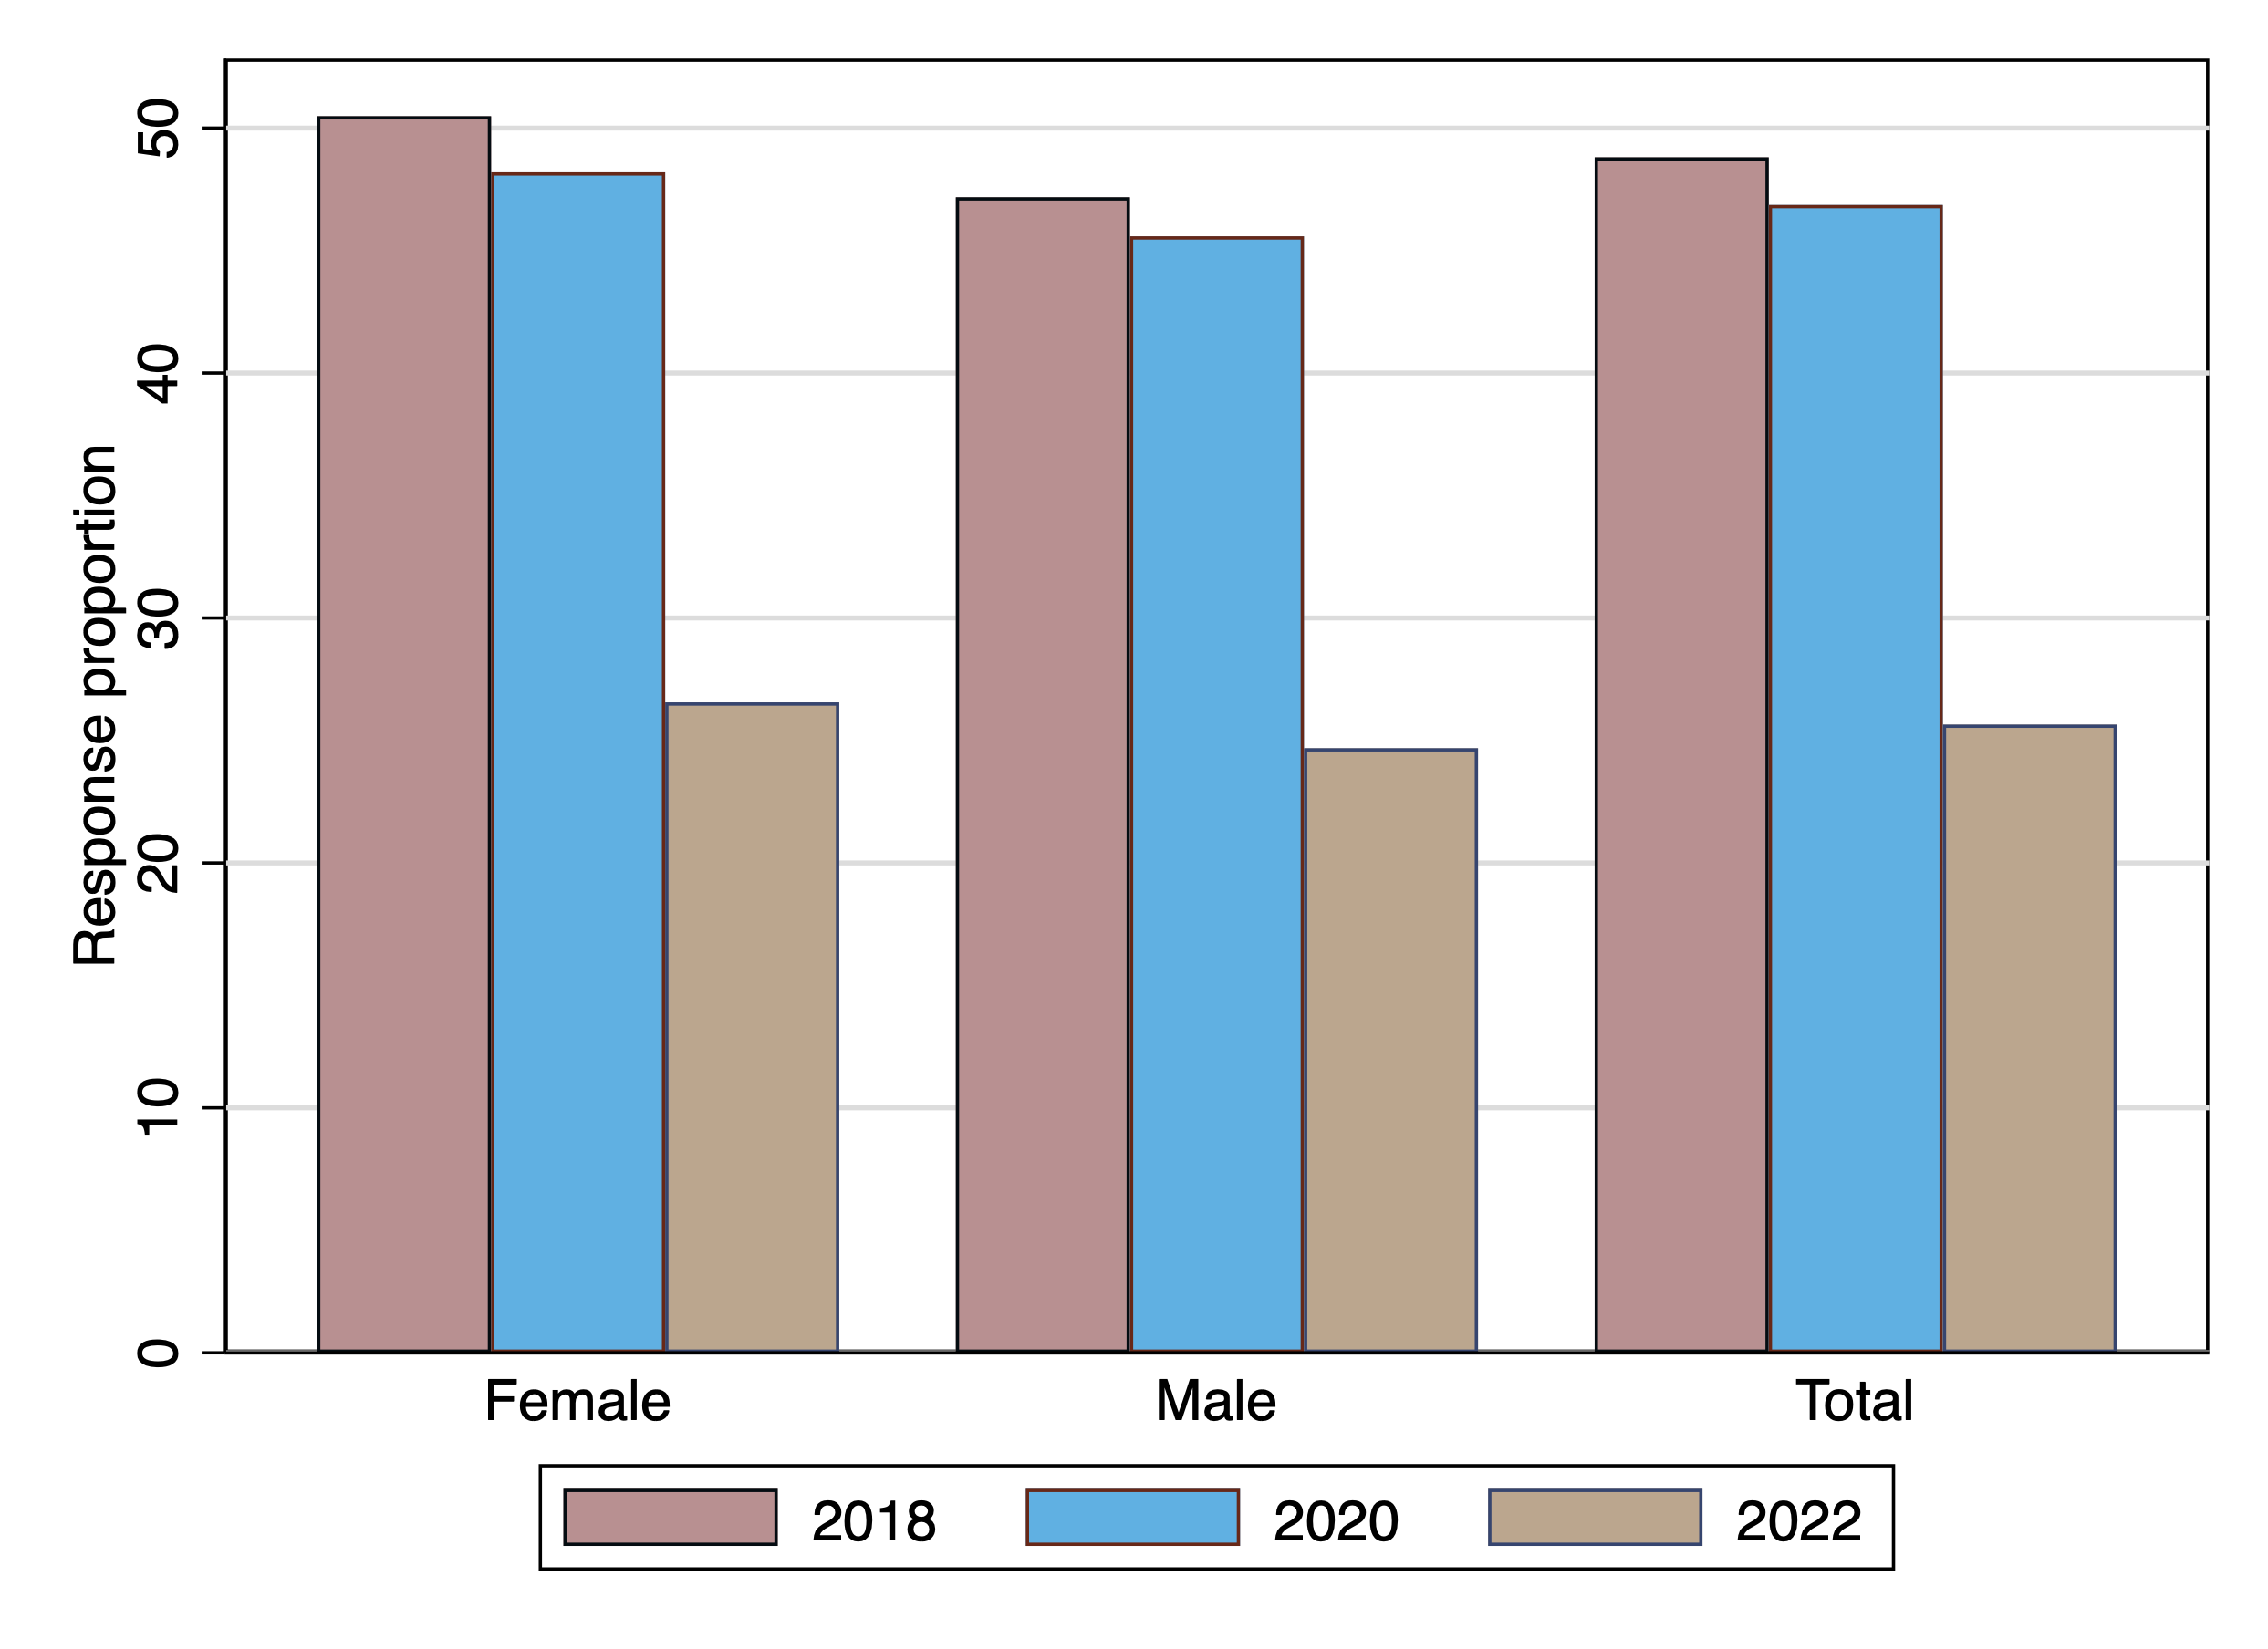
The response rate in the first post-pandemic survey is half the response rate in the last pre-pandemic survey, a huge drop, and is well into junk-survey territory. It is simply impossible to trust a survey with a 25% response rate. With a response rate this low, we cannot expect to accurately describe what is happening in the community, because some groups are almost certainly under-represented. It is likely that the people who respond to the survey are much less representative of the community than in the previous survey - more likely to be healthier than average, or more likely to be unhealthier than average, or wealthier than normal, or poorer than normal. Unfortunately we cannot tell how they are different, because we don't have data on the other 75% of the people who were approached to conduct the survey and refused.
Another reason we cannot compare this survey with pre-pandemic surveys is that the methods of data collection were changed after hte pandemic started, to protect survey interviewers and respondents from COVID-19 infection. This article describes in detail how the survey changed, including multiple changes to the sampling method. It's possible that the post-pandemic sampling method was better, or worse, but regardless, we can't compare surveys that changed sampling methods - or we need a lot of caveats that are not mentioned in the FT article. So we should not conclude that the trend in obesity rates in the USA has changed.
The change may not be unusual
The FT graph shown in Figure 1 hides a bit of information, because it is taken over a longer period and has a y-axis extending to 0, so it's difficult to see how obesity rates have changed in recent years. Figure 3 shows a zoomed-in view of the trend in the most recent 20 years, and in this figure it is clear that obesity rates have dropped before, and in fact dropped in 2020 as well as 2022.
Figure 3: Trend in age-adjusted obesity rates, 2000 - 2022
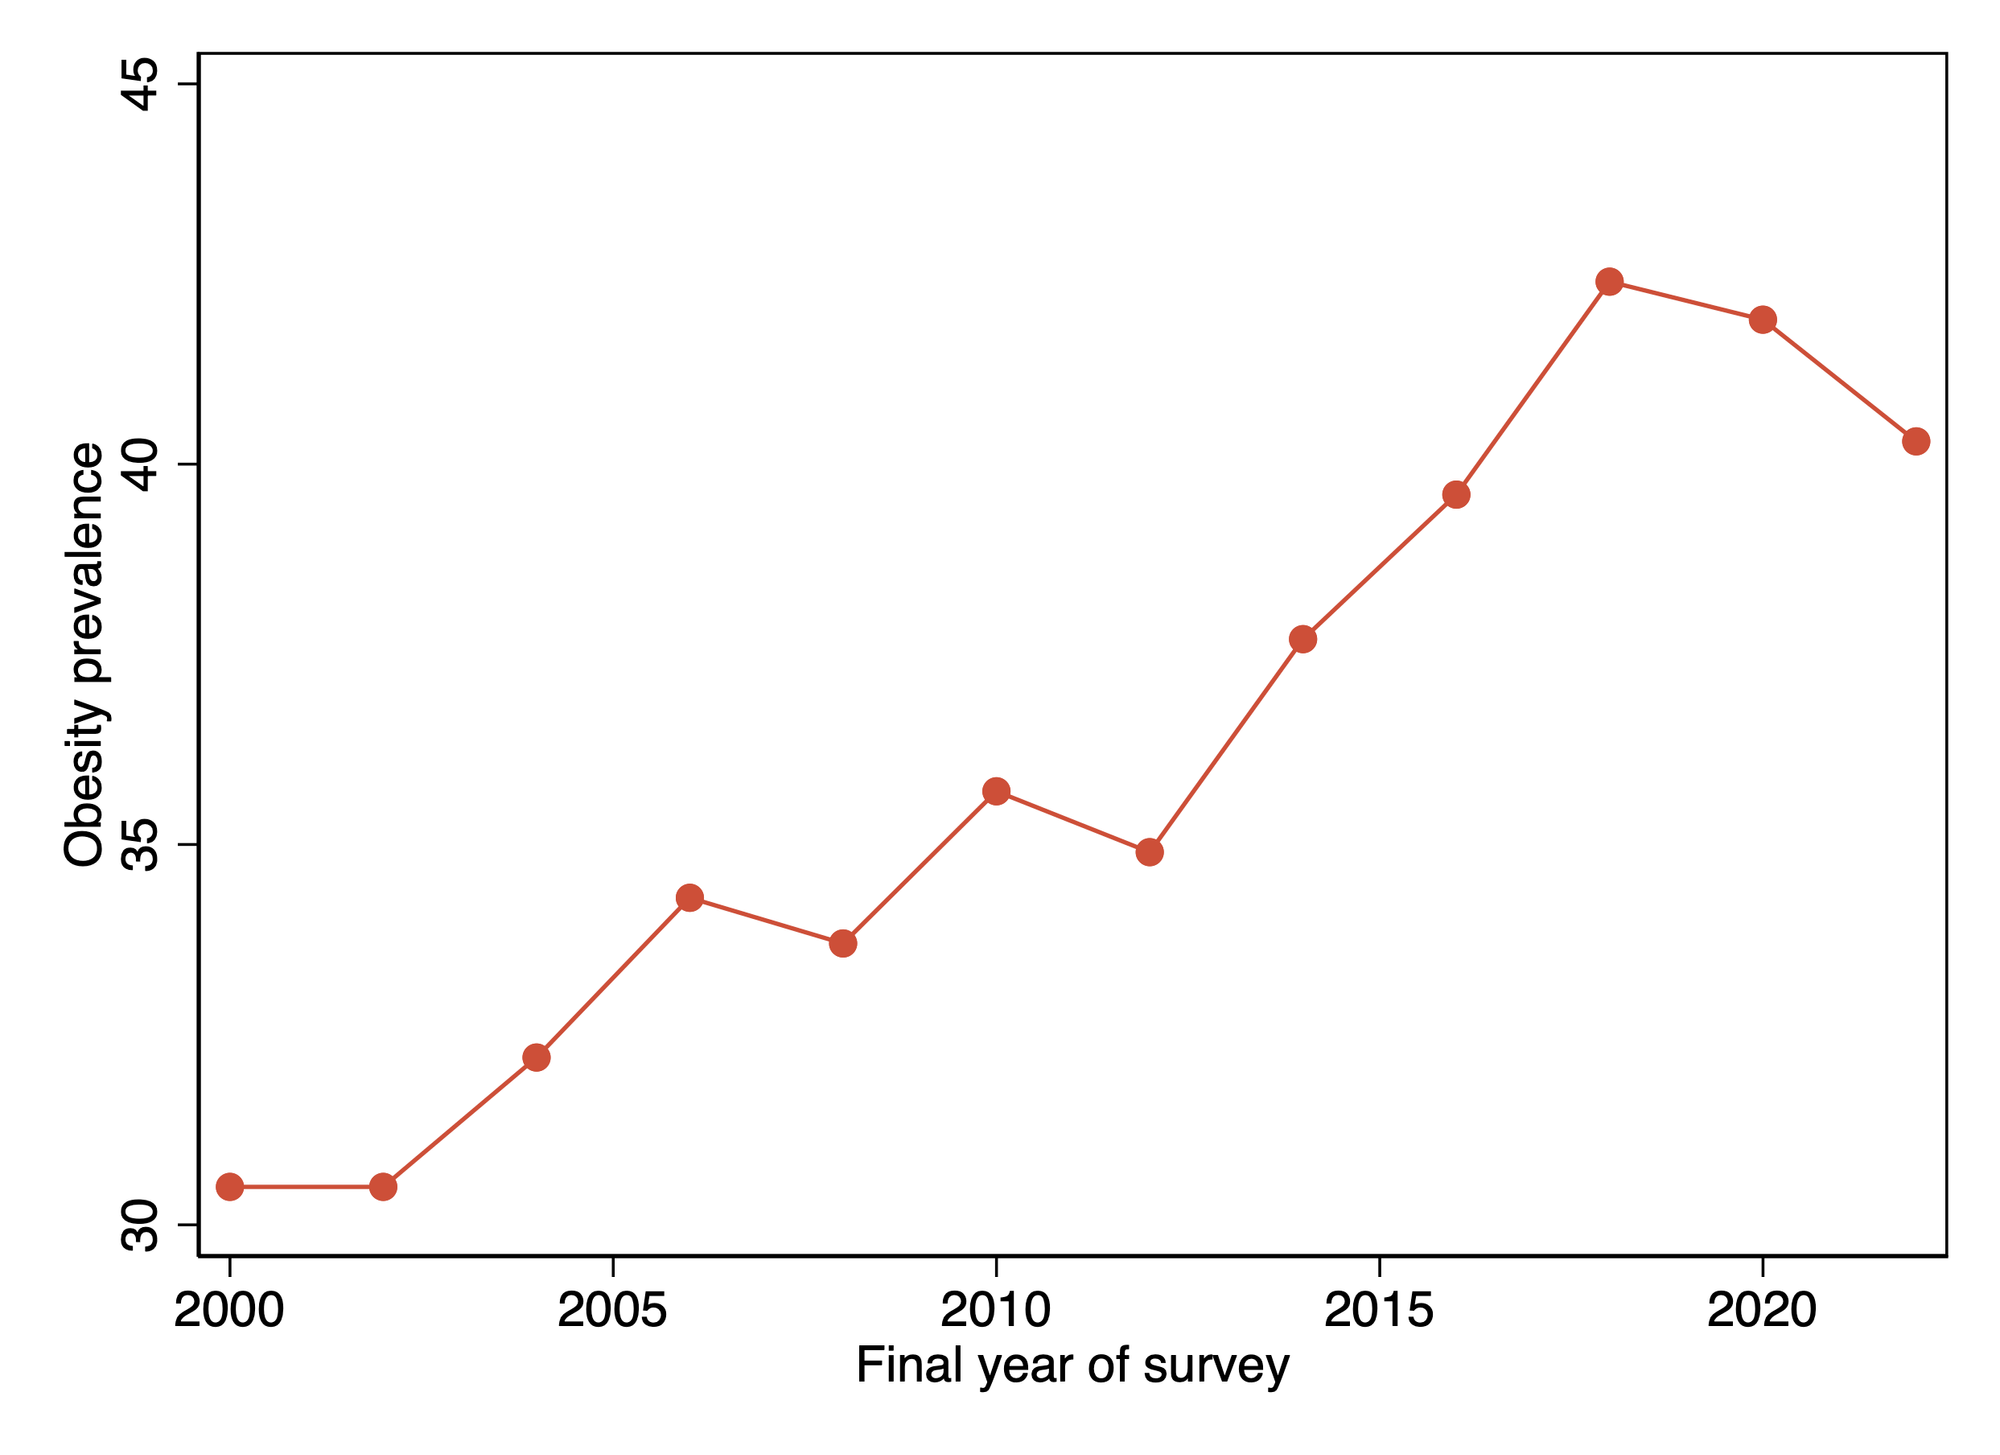
Note that the obesity rate dropped in previous surveys between 2000 and 2010. The percentage changes in most of these declines are about 1-2.5% of the previous level. Again, in this figure I have used a convenience measure of the year of the survey, which is the final year in which the survey was taken for the pre-pandemic surveys, and 2022 for the post-pandemic survey. So the 1.2% decline in obesity rate reported in 2020 is from data that was collected between 2018 and 2020. But Ozempic was only approved for use in the USA on 5th December 2017, so it is unlikely that many people were using it when this survey was conductded. The pre-pandemic decline is not likely to be due to Ozempic!
While the post-pandemic change in obesity rate is larger (a 3.8% drop), the drop in 2012 was 2.2%, so it is not unheard of to see a decline in obesity. It could be random variation, or it could reflect the effect of the sudden crash in response rates. There is no speical reason to credit a drug for this drop.
Finally, it's important to note that severe obesity has continued to increase. The prevalence of severe obesity was 9.4% in US adults in 2023, compared to 9.2% in 2020 and 8.7% in 2018. It's a little strange that Ozempic caused a big drop in obesity but severe obesity increased!
A point related to this to consider, is that if Ozempic is being widely used, it is likely being particularly heavily used by severely obese people, and it is likely that these people would see their BMI reduce to the extent that they would be reclassified as obese. Such a change could see the prevalence of obesity increase as people left this group. There is no reason to suppose that an effective population-wide weight-loss program would cause obesity prevalence to go down as the program scaled up. The changes we would expect to see would depend on the extent and speed of adoption of the program and the effect of the program. So what do we know about these?
Ozempic use is not yet widespread
The FT report claims that 1 in 8 adults in the USA have used Ozempic, and 6% are currently using it. This claim is based on a report from the Kaiser Family Foundation (KFF), but this report is based on one of the KFF's health tracking polls, which is basically just an online survey of 1500 Americans. The methodology is shown in Figure 4.
Figure 4: KFF health tracking poll methodology
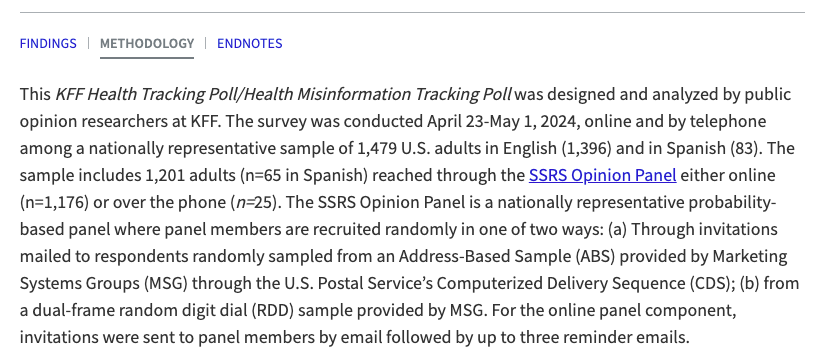
This is not an especially representative or reliable type of polling. In particular, online polls are notoriously unrepresentative, and we should not be fooled by the phrase "nationally representative" to mean that the poll represents Americans. In this context "nationally representative" means that the poll attempts to reflect the geographic, age, and sex distribution of the population - not to reflect accurately the views of Americans (which we cannot ever know we are accurately reflecting). Selection and non-response bias in these types of polls is enormous.
In contrast, Epic Research have provided CNN with data on Ozempic prescriptions from a dataset of millions of health visits, linked between various databases. This suggests that only about 4% of adults have ever used Ozempic, and also finds a huge inequality in its use. Figure 5 shows the trend in Ozempic use from the Epic Research data.
Figure 5: Trend in Ozempic use from Epic Research data
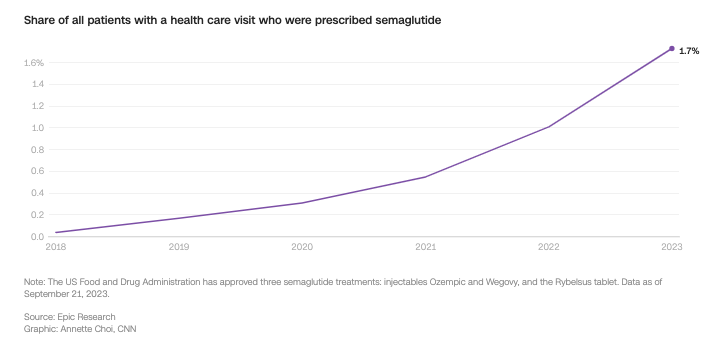
Take up has certainly been rapid, and we can expect in future it will be widespread, but it is not yet anywhere near 1 in 8 people. We also have little information about what proportion of users are obese or severely obese, compared to overweight. But a 4% prevalence of use is unlikely to shift the obesity statistics much unless it is extremely highly skewed, and the drug extremely effective. So how effective is Ozempic?
Ozempic's effects are large but not miraculous
Epic Research has published a report on weight loss outcomes among a large sample of nearly 15,000 Ozempic users, and assessed weight loss at 60 weeks by dosage. Figure 6 shows the sustained median weight loss as a percentage of body weight for those on moderate doses, by diabetes status.
Figure 6: Sustained weight loss by diabetic status at 60 weeks
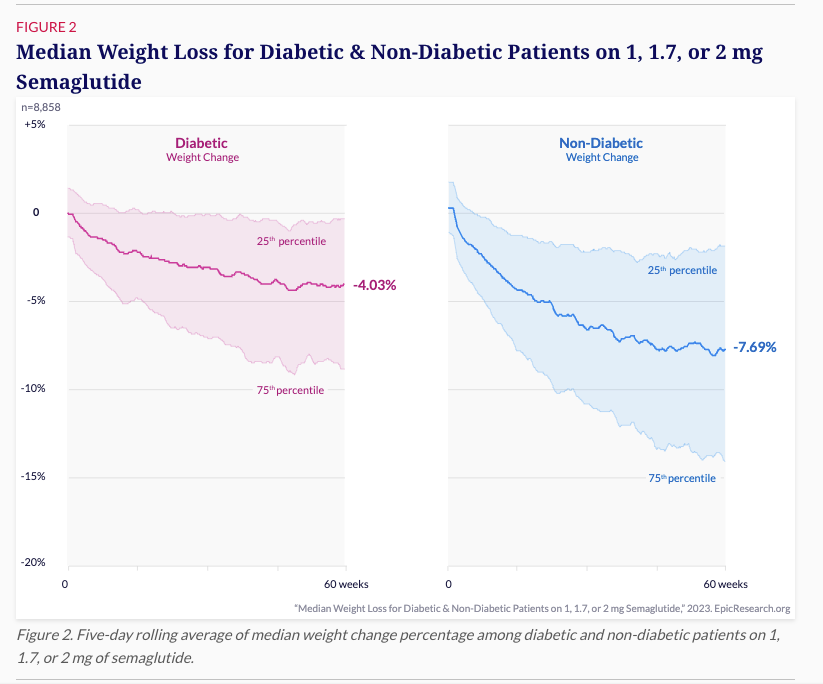
These are solid, impressive results, but they aren't world-shaking. A median weight loss of 8% in non-diabetics means that, for example, an obese person with a BMI of 33 will see their BMI drop to 30.4 - still classified as obese. Since severe obesity is defined as a BMI of >40, anyone who is severely obese and loses less than 25% of their bodyweight will simply be classified as obese at the end of their 60 weeks of treatment. That is an enormous gain for that individual, but statistically it is going to increase the prevalence of obesity at the population level unless an overweight person also manages to lose >10% of their bodyweight in the same time frame, being reclassified as overweight.
Furthermore, the Epic Research report finds 25% of low-dose Ozempic users gained weight.
Based on these results there is no reason to assume that rapid take up of Ozempic from a low dose would have achieved a reduction in the population level of obesity in the USA. It might in future, but we need to see what uptake, adherence and outcomes look like.
It's also worth remembering that with many of these kinds of drugs, as the treatment is scaled up from the initial users to the broader population, it expands to cover more people who are less motivated to achieve the outcome the drug aims for. These people will have worse adherence and poorer outcomes, and we will see the effectiveness of the drug decline. This effect is pretty well-known for methadone maintenance treatment (MMT) for example, and it is often the case that people who register for studies early on in a program's implementation, and the early adopters of the program once it is approved, are the most motivated. Ozempic helps, but it won't overcome the many other reasons that people gain weight or fail to lose weight. As it expands to cover more of the population we should expect the results to be less impressive.
The danger of wishful thinking with data
There is a big and widespread phenomenon among public intellectuals, pundits, political influencers and the more "rationalist" commentators on social issues to latch onto any graph or data that confirms one's biases, and to present it as "scientific" evidence for why one is right. We see this in that group of commentators (like Steven Pinker) who think the world is just getting better; in the many men I think of as "graphbros" who haunt Twitter and Bluesky presenting charts that show inflation is down, wages are up, and everyone's happy; and among a certain type of techno-optimist who thinks that every social or environmental problem can be solved by technology. These guys (and I think they are almost all men!) latch onto a figure that shows they're right and present it uncritically, without checking the source data. They often don't know a great deal about how the data is collected, what it is used for, how the measures are calculated, or what the limits of the data are. This is a dangerous practice, a kind of wishful thinking with data.
At the same time the quality of many of the data sets we have come to rely on has been declining, sometimes precipitously. The American Community Survey and Current Population Survey, as well as some expenditure surveys, have seen rapid declines in their response rates. The post-pandemic collapse in NHANES response rates renders it effectively useless for serious analysis, and we are increasingly seeing attempts to subvert the Census. For example in the most recent Scottish census there was a campaign to record "Believer in biology" as a religion by anti-transgender activists, and in the USA there are ongoing efforts to include citizenship and illegal migration data in the census, to discourage migrants from recording it.
At the same time we know that young people, in particular, essentially refuse to answer their phones to unregistered callers (especially in the USA) and it is fairly well understood that poorer people, those doing gig work, and the unwell and disabled people are less likely to cooperate with surveys. As response rates collapse these surveys become more and more vulnerable to this kind of response bias, and we need to be increasingly cautious about using them. This FT article is a case in point, with a journalist building a highly speculative story out of the whole cloth of a national survey with a catastrophically bad response rate, and an online poll.
Whenever a journalist or pundit presents a line on a graph, we should first check the response rate and the survey method. Only then can we begin to interpret the results!
About inequality in Ozempic use
The Epic Research data provided to CNN, which I linked above, also shows that the drug is much more likely to be used by white Americans, and although the data is not presented, it is also much more likely that wealthier people and people with better classes of insurance will be using the drug. Obesity in the USA is already a disease of poverty, with clear differences in obesity prevalence by income and race. While Ozempic has a lot of promise as a treatment for one of the USA's biggest health problems, it is also possible that as its use becomes more widespread it will further entrench the relationship between poverty and social exclusion and obesity. If so, we can expect to see the already stark differences in health outcomes in the USA worsen as rich white people gain all the benefits of this wonder drug.
As always, equity needs to be at the center of our policy making, to ensure we do not make already unequal societies worse.
Conclusion
It is not possible to conclude that obesity rates have started falling in the USA, and it is not possible to say that this is due to Ozempic. Worse still, it appears that the continuing collapse in social trust in the USA has now rendered one of its flagship health surveys, NHANES, effectively useless for health and policy research. Rather than using it to make shaky arguments about the future of obesity in the USA, we should be demanding a renewed energy to repair and invigorate it, if we want to have any understanding of population health in the USA.